• Home
  • About
  • WHAT WE DO
    • Reusable Systems
    • Event Services
  • WHO WE WORK WITH
    • Councils
    • Events & Festivals
  • Wash Trailers
  • Impact
  • Sponsor Reuse
  • Contact
  • More
    • Home
    • About
    • WHAT WE DO
      • Reusable Systems
      • Event Services
    • WHO WE WORK WITH
      • Councils
      • Events & Festivals
    • Wash Trailers
    • Impact
    • Sponsor Reuse
    • Contact
  • Home
  • About
  • WHAT WE DO
    • Reusable Systems
    • Event Services
  • WHO WE WORK WITH
    • Councils
    • Events & Festivals
  • Wash Trailers
  • Impact
  • Sponsor Reuse
  • Contact

REUSE YOU CAN MEASURE.

Less single-use waste. More items kept in circulation. Results you can actually report. 

Eco Trilogy doesn't just deliver reusable equipment. We track what happens throughout the event so organisers can understand how the system performed and what it achieved.

From reuse activity and return rates to estimated single-use items avoided, our reporting turns event operations into measurable outcomes.


Because sustainability should be something you can demonstrate — not just something you talk about. 


REAL EVENTS. REAL RESULTS.

We measure how reuse performs in the real world — tracking circulation, returns and the single-use items displaced at each event. 

REUSE ACTIVITY

Track how many reusable items move through the system during an event. 

RETURN RATES

Measure how effectively reusable items are recovered and kept in circulation. 

SINGLE-USE ITEMS AVOIDED

Estimate the disposable cups, plates, bowls and other serviceware displaced through reuse.

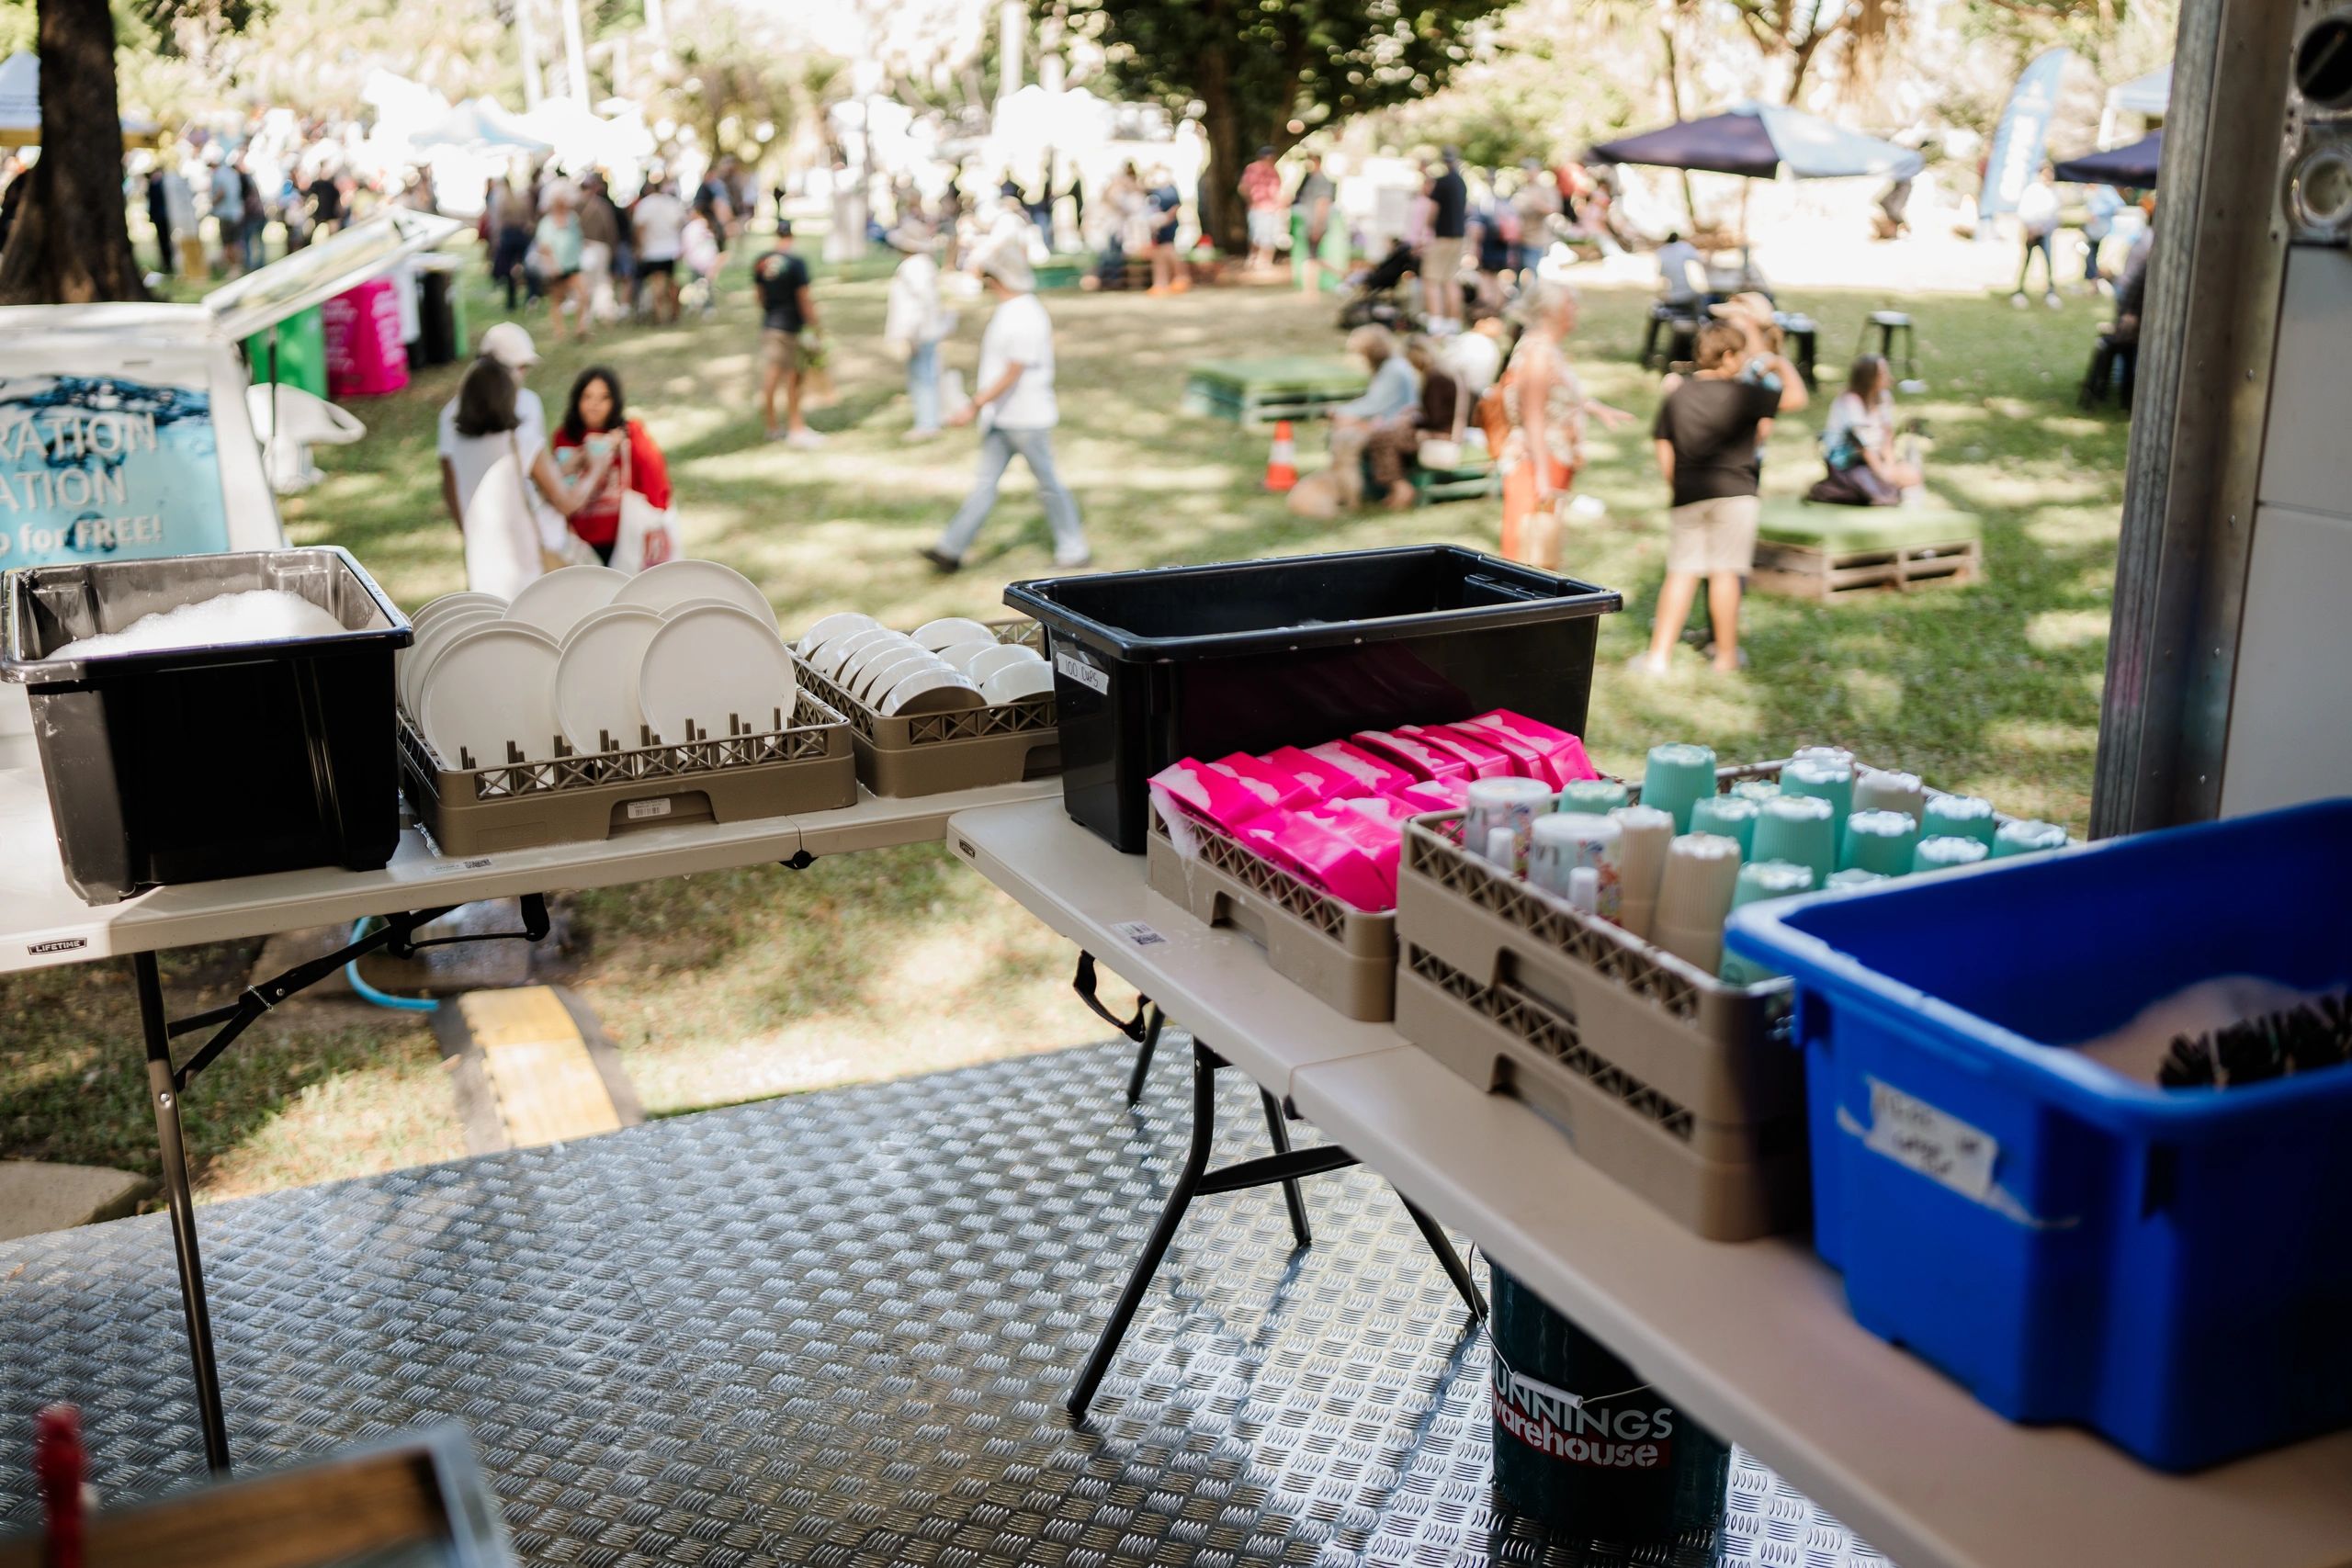
REUSE IN ACTION — TWEED STREET PARTY 2026

3,562 REUSABLE ITEMS SUPPLIED

648 ADDITIONAL USES THROUGH RECIRCULATION

648 ADDITIONAL USES THROUGH RECIRCULATION

 Physical reusable inventory supplied to vendors. 

648 ADDITIONAL USES THROUGH RECIRCULATION

648 ADDITIONAL USES THROUGH RECIRCULATION

648 ADDITIONAL USES THROUGH RECIRCULATION

 Items washed and sanitised onsite, then returned to vendors for another use. 

4,210 TOTAL REUSABLE USES

648 ADDITIONAL USES THROUGH RECIRCULATION

4,210 TOTAL REUSABLE USES

 Total distribution to vendors, including recirculated items. 

3,328 ITEMS RECOVERED

3,435 SINGLE-USE ITEMS AVOIDED

4,210 TOTAL REUSABLE USES

 Reusable items recovered at final reconciliation. 

93.43% INVENTORY RETURN RATE

3,435 SINGLE-USE ITEMS AVOIDED

3,435 SINGLE-USE ITEMS AVOIDED

 Based on the 3,562 physical reusable items supplied. 

3,435 SINGLE-USE ITEMS AVOIDED

3,435 SINGLE-USE ITEMS AVOIDED

3,435 SINGLE-USE ITEMS AVOIDED

 Estimated disposable cups and food containers replaced through reuse. 

WHAT DID THAT MEAN FOR WASTE?

81.36 KG LANDFILL WASTE AVOIDED

10 × 240L BINS LANDFILL BINS AVOIDED

81.36 KG LANDFILL WASTE AVOIDED

Estimated weight of disposable cups, food containers and pizza boxes avoided through reuse. 

2,397 L LANDFILL VOLUME AVOIDED

10 × 240L BINS LANDFILL BINS AVOIDED

81.36 KG LANDFILL WASTE AVOIDED

Estimated uncompacted volume of single-use packaging avoided. 

10 × 240L BINS LANDFILL BINS AVOIDED

10 × 240L BINS LANDFILL BINS AVOIDED

10 × 240L BINS LANDFILL BINS AVOIDED

Equivalent to approximately 10 standard 240L bins of uncompacted waste. 

DON'T JUST TAKE IT FROM US.

 Source: Street Party | Tweed Regional Museum 

Copyright © 2026 Eco trilogy - All Rights Reserved.


Powered by

This website uses cookies.

We use cookies to analyze website traffic and optimize your website experience. By accepting our use of cookies, your data will be aggregated with all other user data.

Accept